8. Text and Annotation
2025. 6. 20. 22:51ㆍPython/Matplotlib
# In[1]
%matplotlib inline
import matplotlib.pyplot as plt
import matplotlib as mpl
plt.style.use('seaborn-whitegrid')
import numpy as np- When we're visualizing data like this, it is often useful to annotate certain features of the plot to draw the reader's attention.
- This can be done manually with the
plt.text/ax.textfunctions, which will place text at a particular $x/y$ value. - The
ax.textmethod takes an $x$ position, a $y$ position, a string, and then optional keywords specifying the color, size, alignment, and other properties of the text.
=>hais short for horizontal alignment
For more information on the available options, refer these url :
Transforms and Text Position
- Sometimes it's preferable to anchor the text to a fixed position on the axes or figure, independent of the data.
- In Matplotlib, this is done by modifying the transform.
- Matplotlib makes use of a few different coordinate systems: a data point at $(x,y)=(1,1)$ corresponds to a certain location on the axes or figure, which in turn corresponds to a particular pixel on the screen.
- Mathematically, transforming between such coordinate systems is relatively straightforward, and Matplotlib has a well-developed set of tools that it uses internally to perform these transforms. (these tools can be explored in the
matplotlib.transformssubmodule) - There are three predefined transforms that can be useful in this situation.
ax.transData: Transform associated with data coordinatesax.transAxes: Transform associated with the axes (in units of axes dimensions)fig.transFigure: Transform associated with the figure (in units of figure dimensions)
# In[2]
fig,ax=plt.subplots(facecolor='lightgray')
ax.axis([0,10,0,10])

# transform=ax.transData is the default, but we'll specify it anyway
ax.text(1,5,". Data: (1,5)",transform=ax.transData)
ax.text(0.5,0.1,". Axes: (0.5,0.1)",transform=ax.transAxes)
ax.text(0.2,0.2,". Figure: (0.2,0.2)",transform=fig.transFigure);
- Matplotlib's default text alignment is such that the "." at the beginning of each string will approximately mark the specified coordinate location.
- The
transDatacoordinates give the usual data coordinates associated with the x- and y-axis labels. - The
transAxescoordinates give the location from the bottom-left corner of the axes, as a fraction of the total axes size. - The
transFigurecoordinates are similar, but specify the position from the bottom-left corner of the figure as a fraction of the total figure size. - If we change the axes limits, it is only the
transDatacoordinates that will be affected, while the others remain stationary.
# In[3]
ax.set_xlim(0,2)
ax.set_ylim(-6,6)
fig
- This behavior can be seen more clearly by changing the axes limits interactively: if you are executing this code in a notebook, you can make that happen by changing
%matplotlib inlineto%matplotlib notebookand using each plot's menu to interact with the plot.
Arrows and Annotation
- Along with tickmarks and text, another useful annotation mark is the simple arrow.
- While there is a
plt.arrowfuction available, I wouldn't suggest using it: the arrows it creates are SVG objects that will be subject to the varying aspect ratio of your plots, making it tricky to get them right. - I'd suggest using the
plt.annotatefucntion, which creates some text and an arrow an allows the arrows to be very flexibly specified.
# In[4]
fig,ax=plt.subplots()

x=np.linspace(0,20,1000)
ax.plot(x,np.cos(x))
ax.axis('equal')

ax.annotate('local maximum',xy=(6.28,1),xytext=(10,4),
arrowprops=dict(facecolor='black',shrink=0.05))

ax.annotate('local minimum',xy=(5 * np.pi, -1),xytext=(2,-6),
arrowprops=dict(arrowstyle='->',connectionstyle="angle3,angleA=0,angleB=-90"));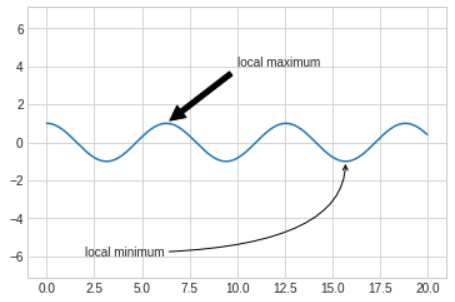
- The arrow style is controlled through the
arrowpropsdictionary, which has numerous options available. - These options are well documented in Matplotlib's online documentation about Matploblib.axes.Axes.annotate
'Python > Matplotlib' 카테고리의 다른 글
| 10. Customizing Matplotlib: Configurations and Stylesheets (0) | 2025.06.20 |
|---|---|
| 9. Customizing Ticks (0) | 2025.06.20 |
| 7. Multiple Subplots (0) | 2025.06.20 |
| 6. Customizing Colorbars (0) | 2025.06.20 |
| 5. Customizing Plot Legends (0) | 2025.06.20 |